

 فارسی
فارسی
Evaluation of the effect of infill walls on seismic performance of RC dual frames: a case study on a damaged building during the 2011 VAN (Turkey) earthquake
M. JAVIDNIA , M. S. RAZZAGHI
1 Master of Science, Islamic Azad University, Qazvin Branch, Iran
2Assistant Professor, Islamic Azad University, Qazvin Branch, Iran
Abstract:
Using infill walls in concrete structures is one of newest methods in seismic retrofitting. The influence of these elements on concrete structures with moment resisting frame or dual system may cause the better or worse performance of structure. Infill walls cause changes in structure performance by increasing stiffness and dissipating energy of structure or changing the strength and capacity of structure, and cause structure to have different response to ground motion.
In this research, a reinforced concrete building damaged in Van earthquake at 2011 Oct. 23, in Turkey has been evaluated by dual system with moment resisting frame and shear walls, and infill walls in both directions, by nonlinear dynamic analysis. By changing the arrangement of infill walls, 17 new samples were created from the original model. Also in order to examine the infill walls performance, 3 earthquakes with different PGAs compared with original earthquake were applied to all samples. The results obtained by dynamic time-history analysis, showed that infill walls have dissipated the most energy of earthquakes in different models, and change in the arrangement of these elements have very important role in the structure performance and changing the location of plastic hinges.
1- Introduction
One of the most common types of isolators in concrete and steel structures are masonry infill walls. During strong earthquakes, infill walls will interact with their enclosure frame which cause will change in the performance of the structure and may create negative effects such as creation of plastic hinges in beams and columns adjacent with infill walls (Nikzad K., Moniri A.H., 1997). A common assumption about infill walls is that these elements always have useful performance in structure and increase the structure strength against the earthquake, while the evaluation of structure performance in presence or absence states of infill walls, by using software such as PERFORM-3D and using time history dynamic analysis are the correct way to judge this subject. In this research the effects of infill walls will be examined in a case study for a structure with dual system, in order to evaluate their effects on the change of overall performance of structure. Infill walls existence, cause to increase the stiffness, but a sudden decrease in stiffness due to infill walls damage (because of brittle of these elements) can lead to form soft story, that is a beginning for joints damage (Paulay T. and Priestley M.J.N., 1992).
2- Software introduction and analysis of usage elements in non-liner analysis
In order to seismic evaluation of structure, model damages calculation and comparison with the actual damages, a non-linear model was created from the studied structure. Time history nonlinear analysis has been used to study the behavior of each member, and PERFORM-3D has been used for running analysis. By using this software complex structures can be analyzed in state of non-linear. This software has powerful capabilities to design based on performance and it can calculate demand/capacity ratios for all components and limited states.
2-1- Beam
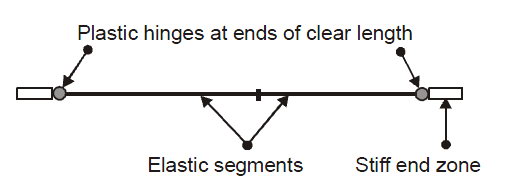
In PERFORM-3D, chord rotation model with all properties based on FEMA-356, are used for beams modeling which are frame type elements. In symmetrical beam element with equal strength on both ends, two “FEMA BEAM” components with equal length, plus two rigid zones on both ends have combined and formed “FEMA BEAM” element in software. PERFORM-3D converts user-defined model to the executive model shown in Figure 1.

Figure 1- Implementation of Chord Rotation Model in PERFORM-3D (PERFORM-3D user guide, 2008)
2-2- Column
Plastic zone model is used for modeling columns in PERFORM-3D. Figure 2 is the schematic view of this model. In this model the plastic deformations are distributed in plastic zones with limited length and plastic zones are modeled by small pieces of fibers.
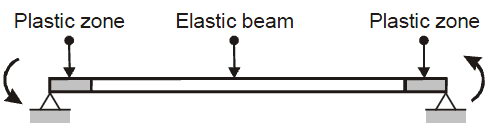
Figure 2- plastic zone model (PERFORM-3D user guide, 2008)
To define fibers, first inelastic concrete and steel materials must be defined, then by using defined materials fiber sections are formed. Cross section of plastic zone that is made from concrete and steel fibers, has been formed from three components composition as shown in Figure 3.

Figure 3- defined fibers in columns cross section (PERFORM-3D user guide, 2008)
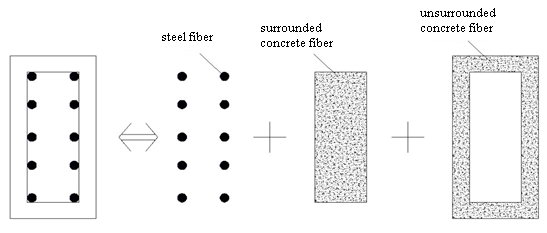
Steel fibers are used to consider reinforcement inelastic properties, and concrete fibers are used to consider concrete sections inelastic properties.
2-3- Shear wall
PERFORM-3D provides nonlinear modeling of wall by using wall elements without need to frame elements for modeling parts of the wall. This element is defined by using some fibers in wall length that non-linear material model has been assigned to them (Figure 4). By using fiber models, the accurately of model can be increased without going to very detailed finite element analysis.
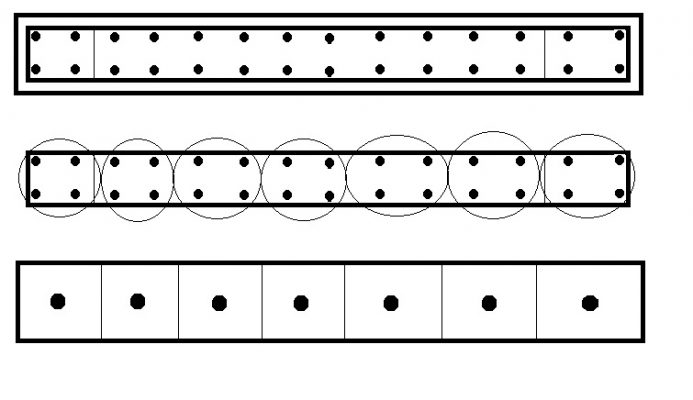
Figure 4- Equivalent sections of concrete shear walls by fiber elements (PERFORM-3D user guide, 2008)
2-4-Infill wall
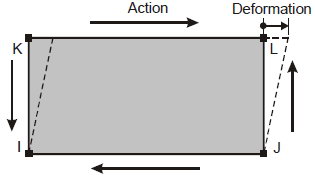
For software model of infill walls, shear model of infill walls as (Shear infill model) has been used (Figure 5). The action for this model is the horizontal shear force and the deformation is the shear displacement over the height of the panel. This component only has in-plane stiffness and shear strength. Bending strength and out-of-plane stiffness has been considered zero (PERFORM-3D user guide, 2008).

Figure 5- infill panel shear model (PERFORM-3D user guide, 2008)
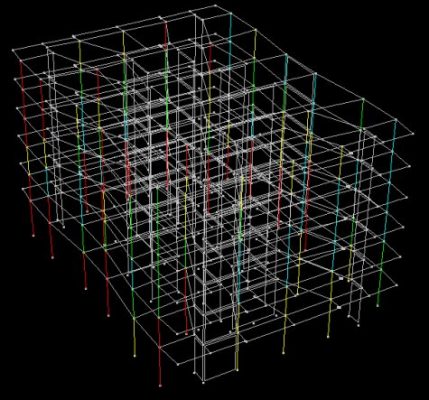
3- Introducing of studied structure and evaluation of the performance during earthquake
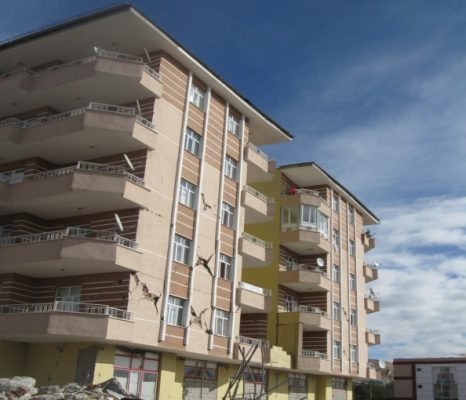
During an earthquake happened at 2011 October near the Van Lake in Turkey with a magnitude of 7.2, many structures were seriously damaged or entirely destroyed. A structure which its performance has been evaluated as the original model is 7-story reinforced concrete building that has reinforced concrete shear walls with 25 and 30 cm thicknesses in both directions X and Y. Figure 6 shows a view of the structure and figures 7 (a) and (b) regularly show the location plan of structural elements of the building on the ground floor and residential floors. In all stories columns cross sections are uniform and equal to 80×30 cm2 and beams are deep type with cross sections equal to 60×30 cm2. Infill walls materials are lightweight cement blocks with 20 cm thickness, 40 Kg/cm2 compressive strength and 22000 Kg/cm2 modulus of elasticity. The name and position of the walls are shown in figure 7.

Figure 6- a view of the case study structure

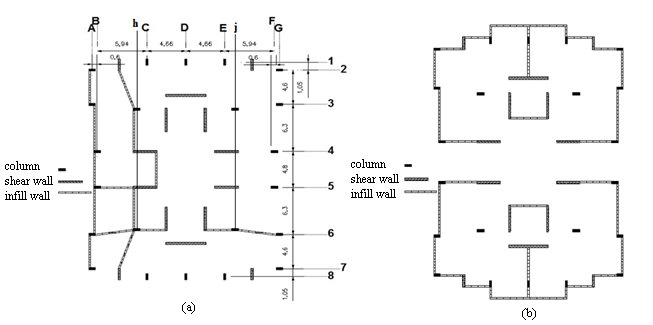
(a): location plan of structural elements (b): location plan of structural elements
in ground floor in residential floors
Figure 7- location plan of structural elements
Geophysics Institute seismograph network of Tehran University has been recorded earthquake at the date of 2011/10/23 with the following specifications:
Table 1- Seismic event specifications of Van earthquake
Country side of Van of Turkey The location of earthquake
2011/10/23 Occurrence date
14:11:17 (at Tehran time) Occurrence time
7.2 Magnitude (Land-scale internal waves)
38.689° North latitude
43.465° East Longitude
19.2 Earthquake depth (Km)
In motioned structure the beams were not been damaged after the quake. Only 3 columns in ground floor and some shear walls were damaged, but many infill walls were seriously damaged.
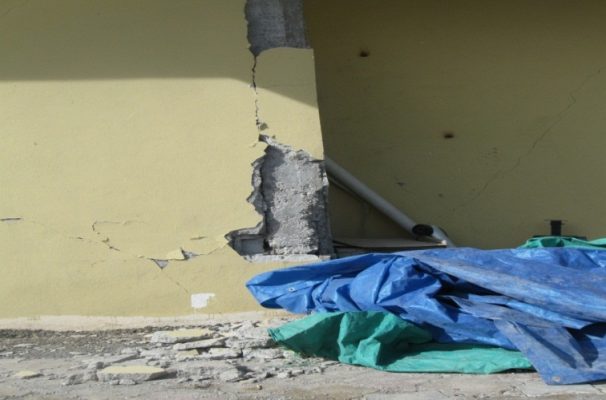
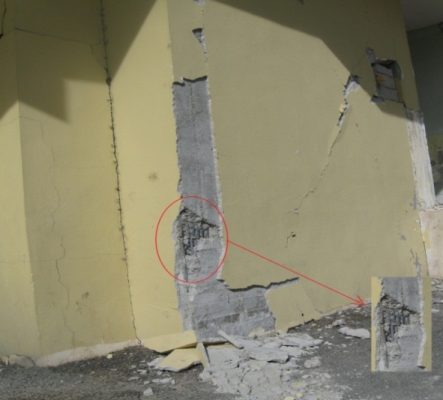
Figure 8- view of created damages in columns
4- Modeling
The different arrangements of these members are used to evaluate the performance of infill walls in mentioned structures. Between many models that could be created from the original model, there were 17 models selected which were largely completed. Furthermore, 3 earthquakes with different accelerogram compared with main earthquake are used, and in these 3 earthquakes all possible arrangements have been considered for infill walls that were reviewed in Van earthquake. Earthquakes data used in this research are listed in Table 2:
Table2- Used earthquakes data
PGA rang Time interval Continuity time magnitude Station No. Occurrence place Occurrence time Earthquake name
0.1-0.2 0.0078 sec 83.5614 sec 7.2 6503 Turkey 23-10-2011 Van
0.4-0.55 0.005 sec 82 sec 6.7 14145 Mulholland California 17-1-1994 Northridge
0.2-0.3 0.005 sec 25 sec 7.1 117 El Centro Array #9 Unites state 19-5-1940 El Centro
0.095-0.1 0.005 sec 30 sec 7.6 CHY016 Taiwan 20-9-1999 chi-chi
Models defined in this study are presented as follows:
Table 3- Models made from the original model
Model name Changes details done for the model
org Structure in real state
test-1 Remove all interior infill walls in ground floor
test-2 Remove all the infill walls (interior + perimeter) in ground Floor
test-3 Add infill walls to perimeter of ground floor (there are interior infill walls)
test-4 Add infill walls to perimeter of ground floor (there are not interior infill walls)
test-5 Remove all perimeter infill walls in ground floor (there are interior infill walls)
test-6 Remove perimeter infill walls in ground floor in X direction (there are interior infill walls)
test-7 Remove perimeter infill walls in ground floor in X direction (there are not interior infill walls)
test-8 Remove perimeter infill walls in ground floor in Y direction (there are interior infill walls)
test-9 Remove perimeter infill walls in ground floor in Y direction (there are not interior infill walls)
test-10 Add symmetric interior infill walls to test-3 sample
test-11 Remove all interior infill walls (interior + perimeter) in all stories
test-12 Remove perimeter infill walls in all stories (there are interior infill walls in symmetric form)
test-13 Remove all interior infill walls in all stories
test-14 Remove perimeter infill walls in all stories in Y direction (there are interior infill walls)
test-15 Remove perimeter infill walls in all stories in X direction (there are interior infill walls)
test-16 Remove perimeter infill walls in all stories in Y direction (there are not interior infill walls)
test-17 Remove perimeter infill walls in all stories in X direction (there are not interior infill walls)
It should be mentioned that models 6, 7, 8 and 9 have been made from the test-3 sample.
5- How to set the non-linear dynamic load cases and evaluation the obtained results from analysis
What can show a more realistic behavior of the structure during an earthquake, is the results of a non-linear dynamic analysis. Due to the complexities of this method, using it for the analysis and design of common structures seems almost impracticable. The old regulations, considered the earthquake only a force, and determined the terms and provisions that the building could resist against this force (force-based design). But new generation of regulations, have discussed a new philosophy of design based on the performance. It means that design of building is done proportional with the performance of the building that we expect. In the old regulations, structural design is done by assuming linear state for the building, but as we know the building in an earthquake enters to non-linear range after linear range and the relationship between the base shear force and the displacement for center of mass of roof, is excluded from linear range and enters to nonlinear range (Hamburger R.O., 1997).
The overall steps for setting up a dynamic force load case in PERFPRM-3D are as follows:
(1) Define the required nodal load patterns.
(2) Set up the required dynamic force records.
(3) Define one or more dynamic force load cases.
In PERFORM in any load case you can apply up to 40 load patterns, each with a corresponding force record. Hence, if you use a dynamic force load case for an earthquake analysis with multi-support excitation, you can apply up to 40 different motions. The response of a structure to an earthquake can depend on the amount of energy that the structure is able to dissipate. In the analysis of elastic structures, it is usually assumed that energy is dissipated by viscous damping (which is a modeling approximation, except for structures with actual viscous dampers). In the analysis of inelastic structures, it is still usually assumed that there is viscous damping, and in addition energy is dissipated by inelastic effects (yielding, friction, etc.) (PERFORM-3D user guide, 2008).
A) The results of the non-liner dynamic analysisVerification:
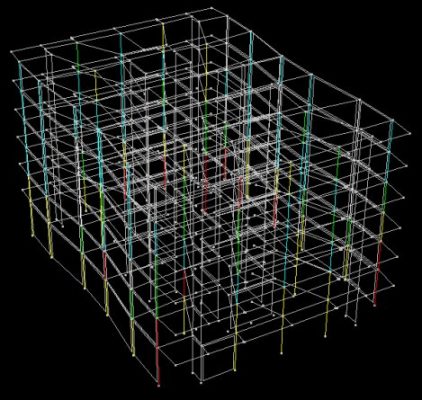
The location of plastic hinges in software model is exactly matched with actual model. As shown in Figure 9 in the software model of main structure, 3 columns were damaged on the ground floor that is exactly consistent with structure performance in the actual model. Comparison of changes of plastic hinges location have been made in several model in Van earthquake in Figures 9, 10, 11 and 12.
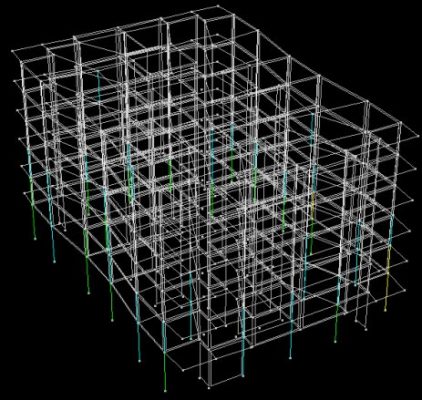
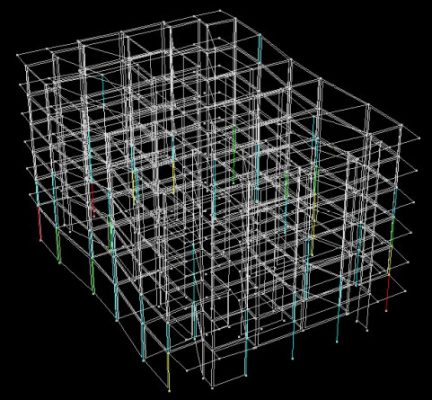
Figure 9- 3 damaged columns in software model of main structure Figure 10- structure performance in test-2


Figure 11- structure performance in test-11 Figure 12- structure performance in test-17
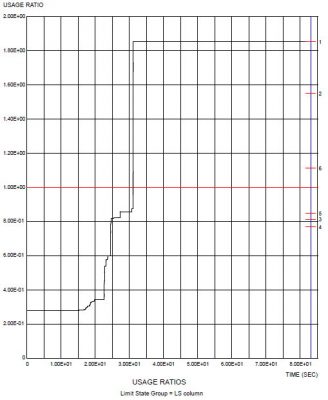
In part of “Usage Ratio Graph” in software, Failure limits for beams, columns and shear walls are visible in the graphs. The figure 13 shows the graph corresponding to LS performance level for main model columns in Van earthquake. Also in Figures 14, 15 and 16 graphs for the other models performance in the Van earthquake are shown.
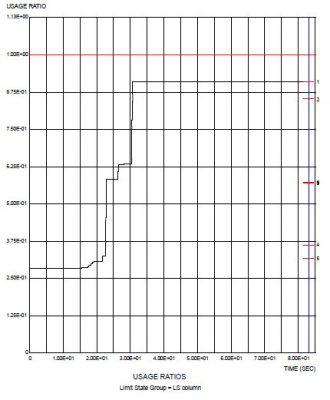
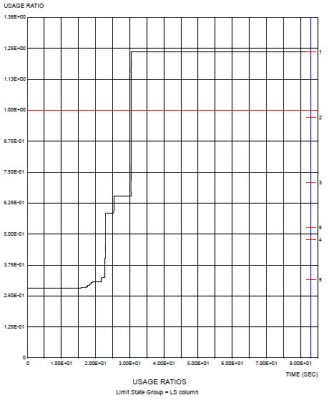
Figure 13- main model columns performance in Van Figure 14- test-2 model columns performance in Van


Figure 15- test-11 model columns performance in Van Figure 16- test-17 model columns performance in Van
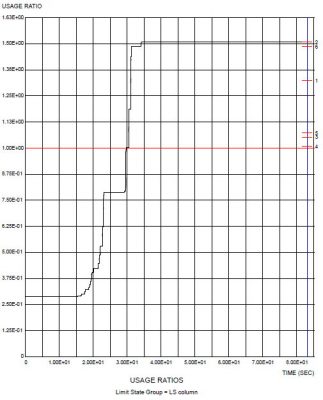
As shown in Figure 13, only the columns on the first floor have exceeded from the 1.00 line, or in the figure 15 with a corresponding (test-11) model, all columns in all stories have exceeded from the 1.00 line. If after the analysis in the strength sections, demand/capacity ratio exceeds from 1.00, it means that hinges are created in these sections.
B) Structure Drift:
The factors that may cause changing the stiffness of structure, such as cracking of members in concrete structures or the presence or absence of infill walls in structure, may cause changing the structure drift. In order to evaluate the relative displacement of different stories and also overall displacement of structure for each defined earthquake in the software, the drift value has been evaluated in different stories. In defined earthquake the minimum of drift value is in first floor and the maximum of drift value is in floors 3 and 4. Because of using deep beams and shear walls in structure, the obtained drift value is suitable and so less than the calculated maximum value.
C) Evaluation of the dissipated energy in each structural member:
The response of a structure to an earthquake can depend on the amount of energy that the structure is able to dissipate. In PERFORM-3D after each analysis, the amount of energy dissipated by whole structure and each of elements such as beams, columns, shear walls and infill walls are stored in 5 types of energy such as kinetic energy, strain energy, αM viscous energy, βK viscous energy and dissipated inelastic energy. Figures 17, 18, 19 and 20 show the energy distribution in each of the above elements for 4 mentioned earthquakes in org model.
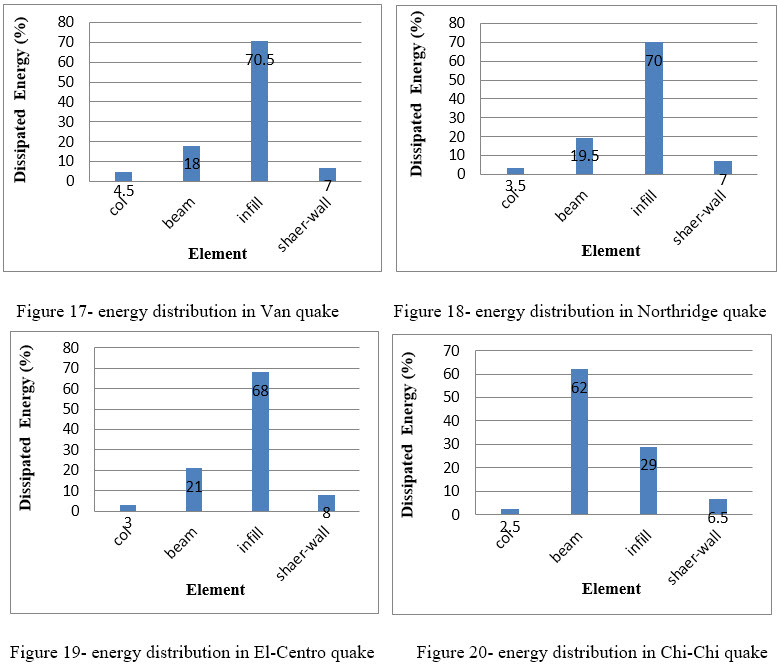
Figure 17- energy distribution in Van quake Figure 18- energy distribution in Northridge quake
Figure 19- energy distribution in El-Centro quake Figure 20- energy distribution in Chi-Chi quake
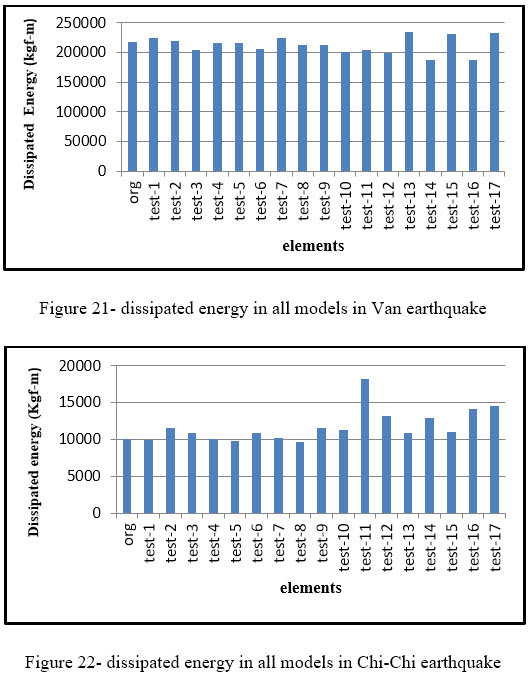
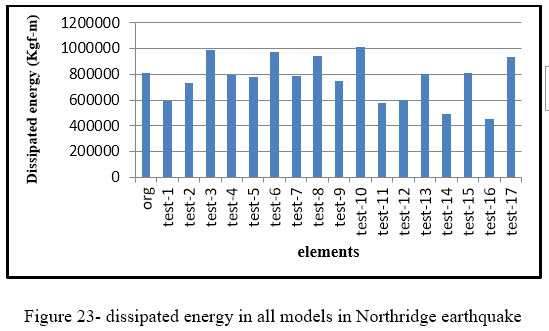
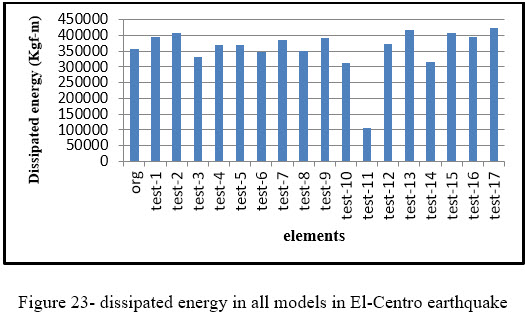
The amount of energy dissipation in all models for 4 mentioned earthquakes have been shown in figures 21, 22, 23 and 24.
6- Conclusion
Studies have shown that in dual system including infill walls, these infill elements have had an important role in the structural performance in desired performance level and prevention from structure collapse. Observed damages in the analytical model are very similar to damages in the main structure (damaged in Van earthquake). For example, the number of columns had been damaged in the main structure, also damaged in analytical model, or in both states the beams absolutely were not damaged. The results of this research can be expressed following forms:
1- The response of a structure to an earthquake can depend on the amount of energy that the structure is able to dissipate. According to presented figures in part (c) of results of the non-liner time- history analysis, the most of the dissipated energy is related to the infill walls (Except Chi-Chi earthquake). Because of using deep beams and the large number of beams in each story, these elements have had important role in dissipating energy. Also a few part of energy has been dissipated by columns and shear walls.
2- The minimum and maximum value of energy dissipation has not occurred in one sample in four earthquakes. For example, in Van and El Centro earthquakes the most value of energy dissipation occurred in test 17, in Northridge earthquake occurred in test 10 and in Chi-Chi earthquake occurred in test 11. In Van, Northridge and El Centro earthquakes the minimum value of energy dissipation occurred in test 16 and in Chi-Chi earthquake occurred in test 8.
3- Changes in infill walls locations lead to significant change in the structure response, that these changes are including changes in the location of hinges, the structure performance level and dissipated energy in structure and its constituent elements.
References:
1- PERFORM-3D user guide, 2008, Nonlinear Analysis and Performance Assessment for 3D Structures (user guide and getting start), version 4.
2- Humburger R.O., 1997, A framework for performance-based earthquake resistive design, NISEE (National Information Sevice for Earthquake Engineering)
3- Nikzad K. and Moniri A.H., 1997, Brick filled walls desirable and undesirable effects on seismic behaviour of concrete frames, Seismology and Earthquake Engineering Bulletin, Vol.2, pp.14-19.
4- Paulay T. and Priestley M.J.N., 1992, Seismic design of reinforced concrete masonary building.